Service Performance 101
Over the past month, I have been going back and forth with a handful of rather unprofessional American bank employees over whether I am as innocent as Yu Qian—the Yu Qian who wrote ‘Ode to Lime,’ not the one with three major hobbies. At the same time, a large wave of feature launches and fundraising-related matters hit. I was so busy that I had no heart to work on the train, grew lazy, and devolved from Zhou Gengxia, the weekly updater, to Yue Gengxia, the monthly updater. My WeChat official account backend and WeChat messages were full of bewilderment: no sooner had I pinned your account than you started playing dirty (I seem to have heard that line a few months ago). Later, when Apple and WeChat started fighting, some friends had a sudden realization and rushed to comfort me: ‘Uncle, don’t cry. Apple on my left, Samsung on my right, Huawei tucked at my waist. The business of adding an egg to breakfast, lunch, and dinner won’t be cut off for you.’ What the hell do you take me for? I’m worth hundreds of thousands a second… one egg is nowhere near enough!
The press release about Tubi TV finally came out; The Wall Street Journal, TechCrunch, and 36Kr all covered us. The key features that needed to launch have launched, and the annoying green-card/EAD/AP matters have been dealt with. At this point, it would be unreasonable not to write something. So today we’ll talk about performance. This is a topic I presented at my team’s all-hands meeting.
When it comes to performance, one cannot fail to mention Netflix’s performance architect Brendan D. Gregg. Brendan has written a great many high-quality articles and has many performance videos on YouTube. If you can absorb even a little from his talks, your cultivation will improve greatly (think of Feng Qingyang and Linghu Chong). Several images in these slides are borrowed from him; in fact, the main ideas also come from a number of his videos and articles. I thank him here across the internet.
When should you seriously consider performance?
This is a question many startup teams care about. For founders, it is equivalent to: when should I hire a ‘real’ CTO?
I think that before real user volume reaches the millions and before the business model is established, performance is not yet the first-order problem. If a few solid engineers can stand up the service, the UX is good, and performance is passable, that’s OK. The focus should be on user acquisition, retention, and the business model. Before I joined Tubi TV, we had no CTO, no VPE. Engineering had many problems, the code was a mess, and API response times often swung wildly between hundreds of milliseconds and 10 seconds—more terrifying than the A-share market. But that did not prevent Tubi TV from becoming a commercially successful company. However, when our MAU grew more than 9x last year, and our user and device volumes reached the millions and tens of millions, performance optimization (and even system rearchitecture) became the top priority for engineering.
How do we measure and optimize service performance?
To measure and optimize service performance, we can start with four steps: measure, analyze, profile, and improve.
Measure
Lord Kelvin said something I quote on many occasions: if you can’t measure it, you can’t improve it.
Before discussing measurement techniques, let’s build a basic intuition for time:
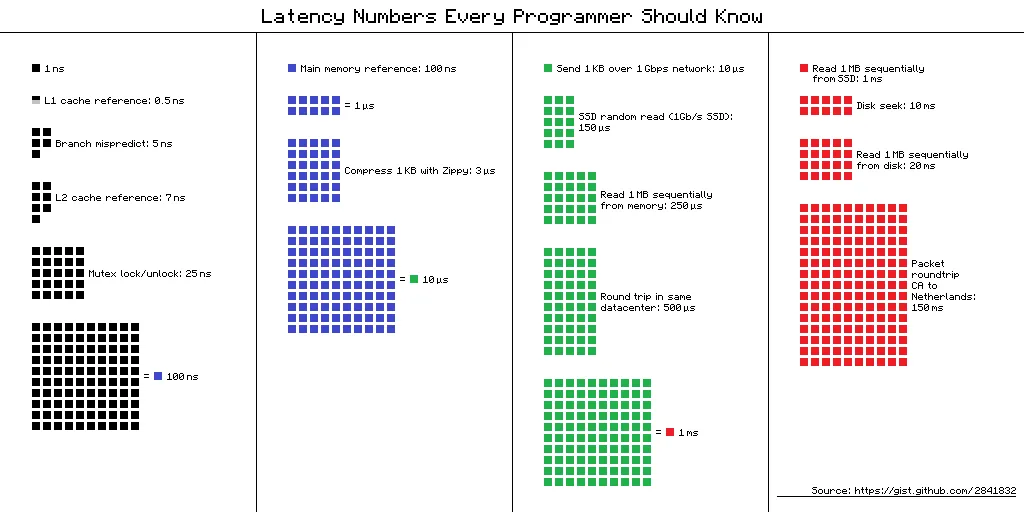
1 ns is a very small unit of time. A 1 GHz CPU has a 1 ns cycle. The CPU’s L1/L2 caches are both on the nanosecond scale. When you write code, every if/else/switch is, at the machine-instruction level, a series of cmp (compare) instructions followed by jmp (jump). The CPU tries to predict which way a branch will go; once it mispredicts, execution pays an extra 5 ns.
ns is the time scale of the CPU.
If the data an instruction needs to access is not in L1/L2 cache, each main-memory access costs 0.1 µs. Zip-compressing 1 KB of in-memory data takes 3 µs. The policy-engine algorithm I described in my policy engine article—the policy check for whether a given video is allowed to play in a given country, at a given time, on a given platform—takes about 7 µs. Sending 1 KB over a 1 Gbps local network takes 10 µs.
1 µs is the time scale of memory; yet sequentially reading 1 MB of memory takes 250 µs. 10 µs is the time scale of a local high-speed network; a packet makes a round trip inside a data center in 500 µs.
10 ms is the time scale of disk. With an SSD, however, sequentially reading 1 MB takes only 1 ms—just 4x main memory.
A packet round trip between the U.S. West Coast and Europe easily burns 150 ms. So no matter how good your service performance is—even if you can optimize it to under 1 ms—the more round trips, the worse the performance. This is why we use a CDN for static content and deploy servers for dynamic content (such as APIs) in data centers close to most users.
From a time-scale perspective, once your service’s response time is already optimized to the order of 100 ms, optimizing the network is more effective than continuing to optimize the service itself.
With this sense of time, let’s look at the measurement techniques available.
System level:
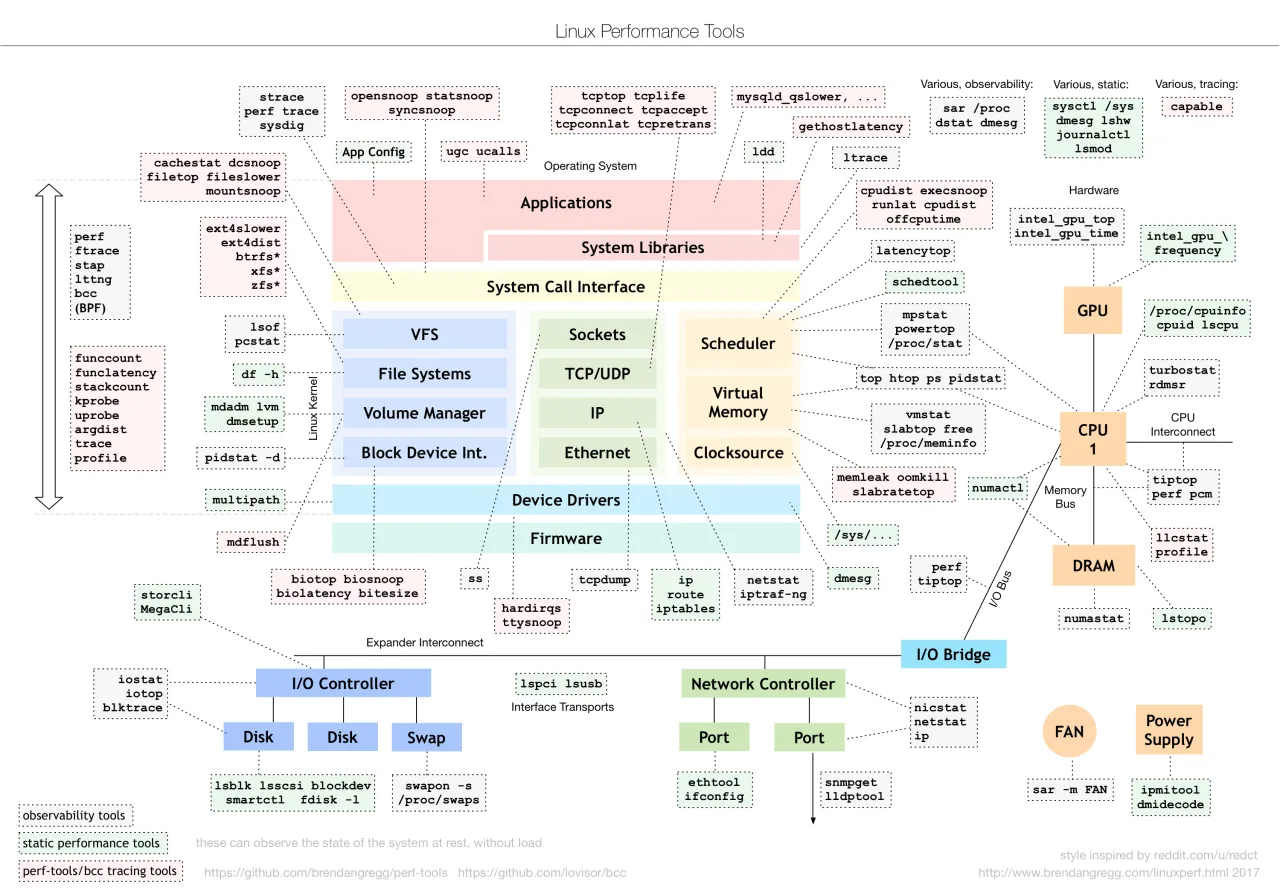
Brendan’s chart is detailed enough to label the corresponding tools for every layer and component of the system. I have never used 80% of these tools—I’ve only heard of them—but the value of such a list is that when needed, you can collect very fine-grained, targeted metrics.
At the VM level, we can collect the VM’s own statistics, including but not limited to CPU utilization, GC metrics, allocator metrics, scheduler metrics, and I/O metrics. This varies by language.
At the app level, it depends on the application, but it boils down to counts of events, messages, and critical function calls; errors and error rates; service response times; and so on. Collecting these metrics takes thoughtful design and implementation.
I wrote an earlier article that also discussed measurement; you can dig it out and take a look.
Analyze
For system-level analysis, see this diagram:
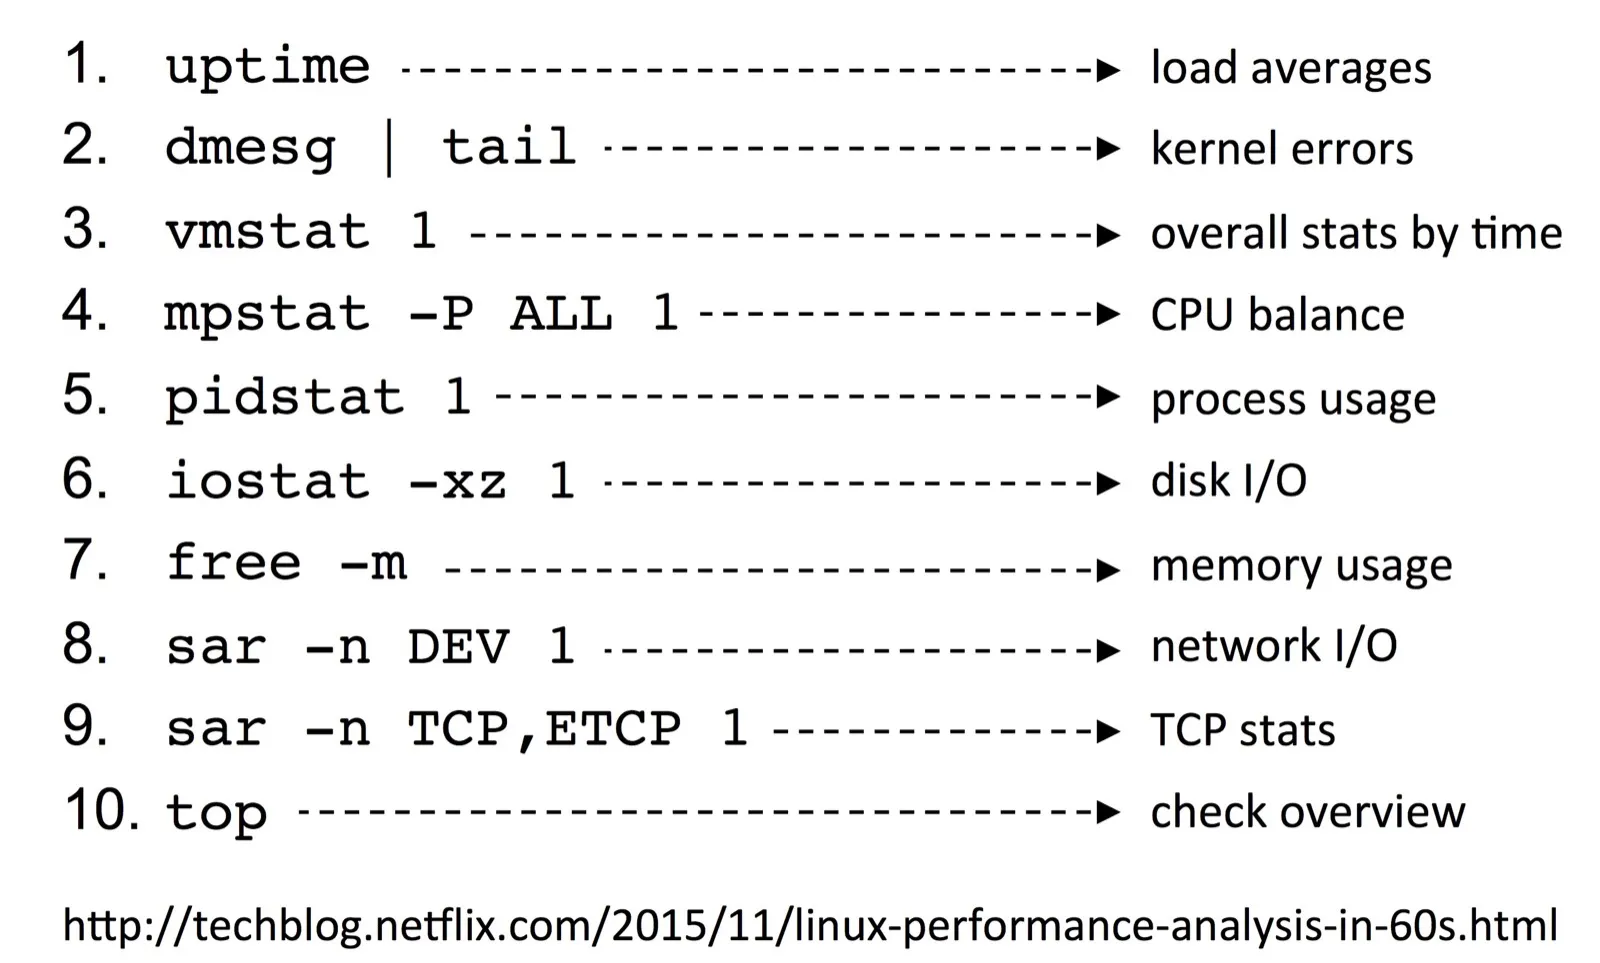
VM-level tools vary widely. For the Erlang VM, we can use etop, pman, observer, wombatOAM, and so on.
At the app level, we can use many third-party tools, such as Datadog, Sentry, Crashlytics, Periscope, and others.
When analyzing collected metrics, visualization is extremely important. Collecting data without visualizing it well seriously hurts analysis efficiency. But visualization is also a double-edged sword: visualizing the same data in different ways (which is in fact a form of pre-interpretation) can lead to completely opposite analytical conclusions.
Profile
After basic performance measurement and forming a notion of the system’s bottlenecks, we can start improving. Often the results of performance analysis directly guide tuning. Sometimes, however, we know some part of the system has a performance problem but are not sure where to start. Profiling helps you locate the paths or functions that take a long time, so you can attack them one by one.
In other words, profiling answers the question: ‘I want to optimize this path; tell me the proportion of time taken by each relevant subpath across the entire call stack.’
Another use case for profiling is gaining a clearer understanding of a part of the system. Through profiling, we can learn the complete call relationships along a critical path, which functions are called many more times than we imagined, which functions’ execution times overturn our assumptions, and so on.
Common profiling tools include gprof, fprof, systemtap, and others; the Erlang VM has cprof, eprof, fprof, lcnt, percept, and so on.
As an aside, choosing a language is sometimes also choosing a toolchain. On this point, Erlang is truly a model citizen of the industry: for almost every OS-level tool you are familiar with, Erlang has a corresponding tool—etop for top, inet:i() for netstat, dbg:trace for strace, and so on. And profiling in Erlang is so satisfying. If you’ve profiled a C codebase, you’ll exclaim that Erlang’s fprof doesn’t require you to recompile the relevant parts to inject code the way C’s gprof does. If you’ve tried profiling Node.js on macOS, you’ll be green with envy that Erlang can finish profiling in two or three lines and then generate a flame graph.
A flame graph is a visualization of profiling results. The following is a flame graph I generated while analyzing the critical path of an Elixir service:
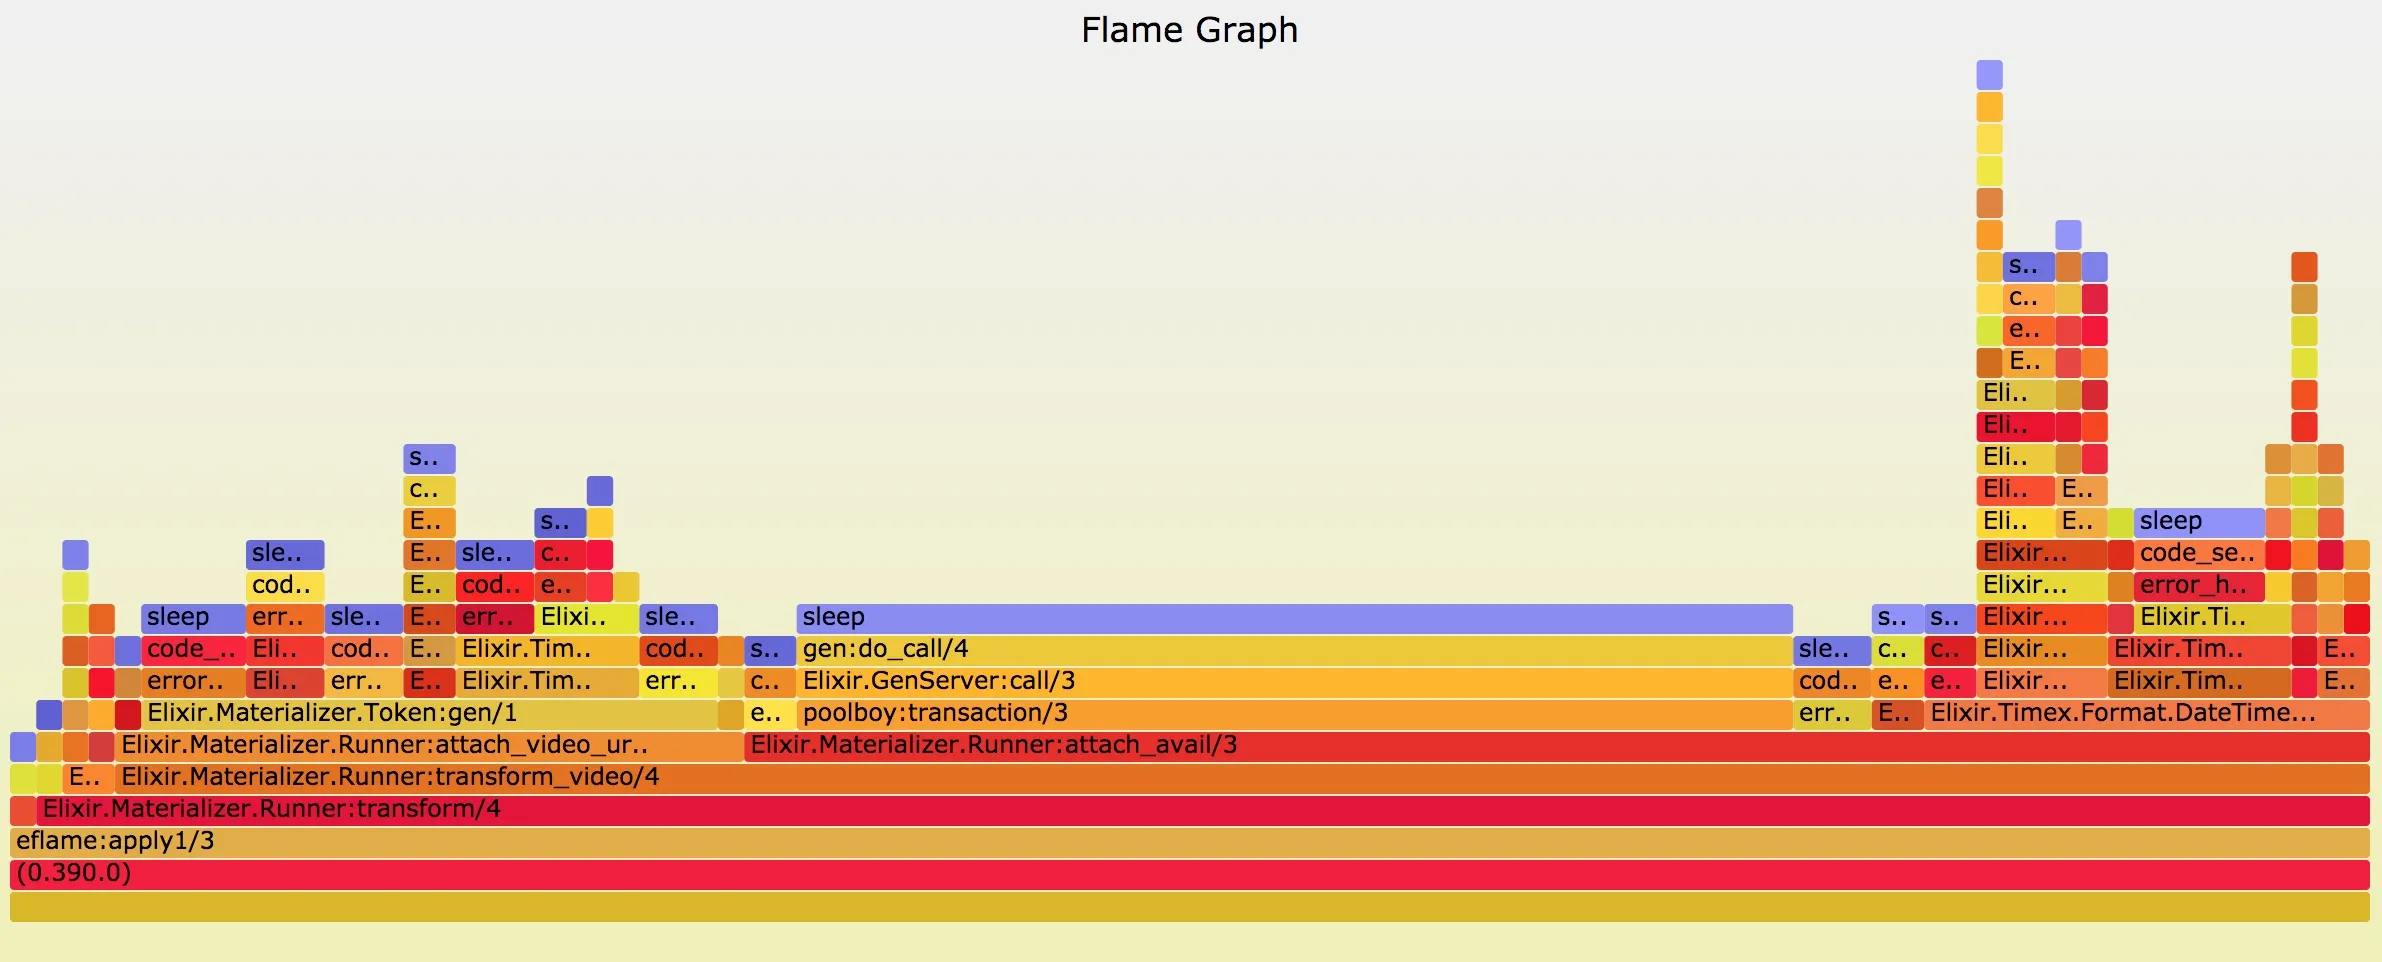
With it, we can easily see which calls consume the most CPU along a path, then dig into those calls and optimize them.
Improve
Once you’ve identified the points to optimize, the road to performance optimization is actually 90% complete. There are many ways to improve next. Here is a screenshot from my slides; it is easy to understand, so I won’t explain it:
That’s enough for now. This article is meant to inspire rather than to serve as a reference; it is an introduction. I hope it prompts you to take performance seriously and gives you a basic understanding of ways to improve it. For more details, please click ‘Read the original’ to view my slides (abridged compared with the internal talk).